
A spreadsheet-driven tool which tracks responsiveness and stability of servers through an organized tracker, formulated using statistical analysis of ping data
What started out as an individual farming tracker grew into an incredibly large project with tons of tracking features. The sheet was released in August of 2021 after a month and a half of development, and two weeks of beta testing.
Official link to MapleTracker
The MapleStory fanbase is filled with players eager to progress and excel at fighting incredibly difficult bosses. There are multiple ways a player can progress: Through legion training, farming, and doing tower of oz. By far, the most significant portion of character progression is done through farming, which grants the user currency and experience. I will thoroughly explain the mechanics of each and how my tracking sheet is geared to help users organize their plans for progression.
The Channel Tracker is the most sophisticated sheet in MapleTracker. It combines heavy data analysis with JavaScript code to produce useful trends. Before I go onto those planning-specific sheets, I first need to explain channels in the game. Each player has a selection of 20 or 30 server IPs, or “channels,” to play on. However, not all channels are created equal. Certain channels are more stable, have better ping, and are less prone to cause disconnections. So, the first thing I wanted to create was a way to track the responsiveness and stability of the game’s servers.
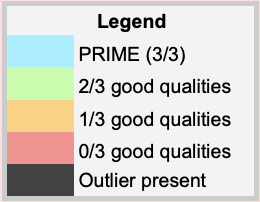
Google Sheets has a built-in VBA Script editor where JavaScript functions can be written. I wrote a function to ping all channel IPs and store this result. This entire data collection procedure is automated, so a user only needs to press the update button one time. Additionally, the data collection will continue every hour for a week. After about a week of tracking the servers, the sample size is large enough to present conclusive results. Fortunately, all API calls in Sheets are carried out by the Google Servers, which is a great feature since these servers are incredibly stable. Any instability with ping results would almost certainly be caused by the Nexon servers. This also means that a user with a weak internet connection can utilize the channel tracker!
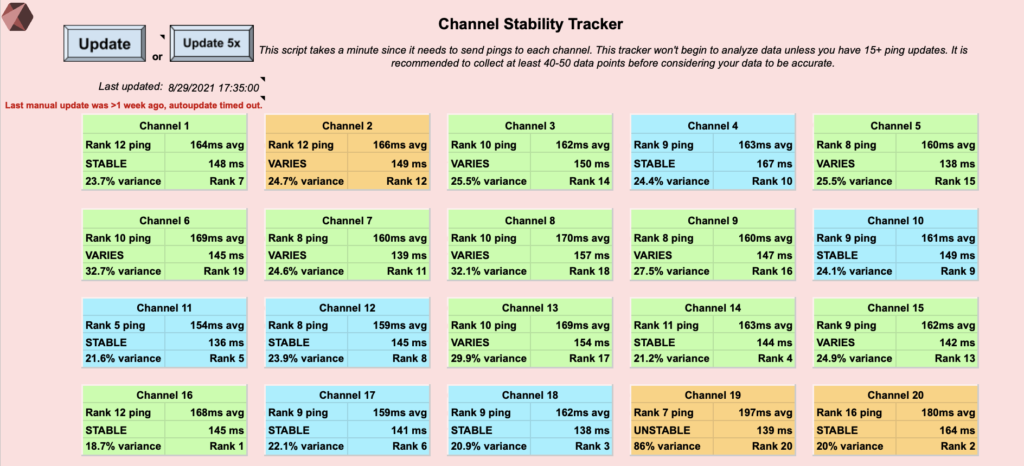
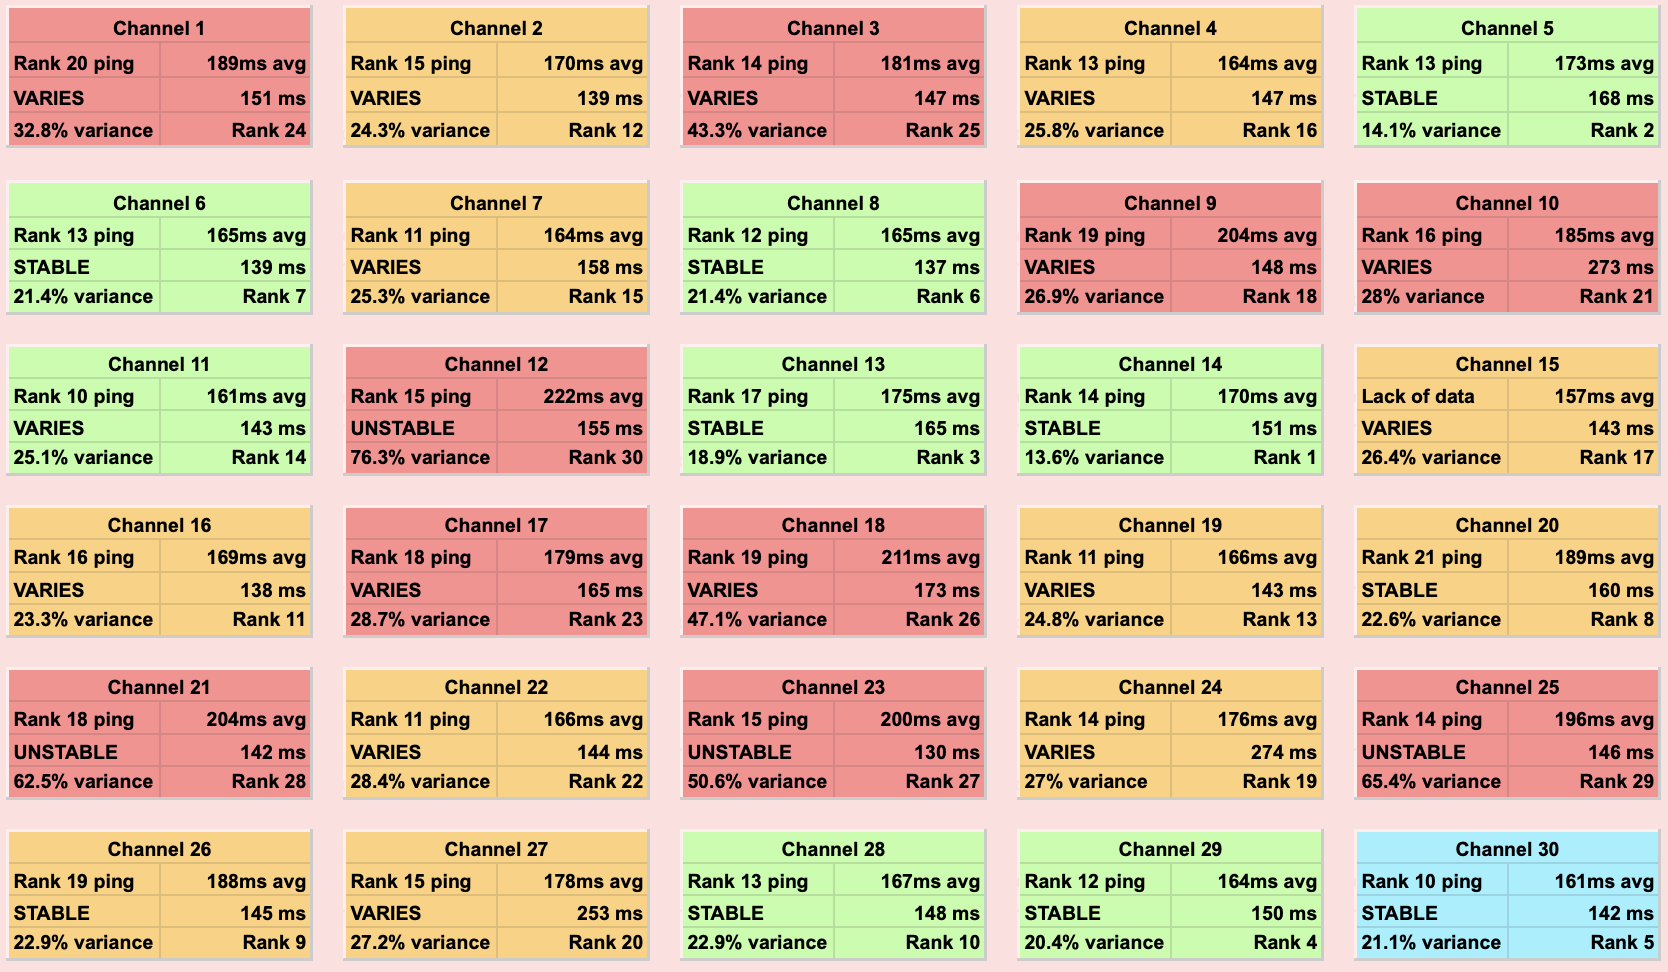
Quickly before I introduce you my calculations, I need to cover a bit of MapleStory jargon. The community calls the best channels prime. I denote prime channels in a teal color if they yield this result. The tier of each channel result is presented below.
Now, I can fully explain how the calculation works in the sheet. There are three aspects that help categorize a channel as prime. Fulfilling 3/3 of these denotes the channel as prime.
Each channel’s ping is ranked from 1-30 for every update. A player can set up a specific rank number to which it is considered prime. For instance, the default setting is 10, so channels with rank 1-10 ping rank fulfill this quality. This quality allows the channels to be directly compared to one another, giving the dataset its one and only purely relative ranking.
Any large dataset has something called variance, which is how much the data varies from its average. I use the Coefficient of Variance in the sheet. When comparing large values like ping values, we prefer dimensionless coefficients to compare between. Taking the standard deviation of a ping set like these would be subject to large inflation for channels with overall higher ping values. Thus, we divide the standard deviation by the mean to obtain a dimensionless coefficient known as the coefficient of variation. This lets us see how much ping in a channel varies from its own average in a given data set.
To explain better why I selected this parameter, let me present an example. Say that we want to compare the stability between two channels with different average pings. Channel 1 has an average ping of 10, and Channel 2 has an average ping of 200. In both datasets, data only varies from the average by a maximum of 5 ping. The interesting question this example poses is, how do we compare their stabilities? Channel 1 has a min of 5 ping, and a max of 15 ping (3x the minimum!) Channel 2 has a minimum of 195 ping, and a maximum of 205 ping. Comparing absolute ping values from the min and max values is not an option, since there is a large inflation of variance at low ping values. However, comparing channels with a higher average ping have a larger standard deviation, which also inflates the variance. Thus, the solution is to divide the standard deviation by the mean.
Once the variance is calculated, the user has the choice to make this a relative or absolute ranking. When using relative rankings, it acts the same as the Relative ping ranking, where the player selects a specific rank number to which a channel is considered prime. However, when selecting the absolute ranking, the user can select the maximum % value for variance allowable to be considered prime.
The Average Ping quality gives the dataset its one and only purely absolute ranking. Each channel’s ping dataset is averaged to one number. The user sets the maximum ping value for a channel to be considered prime, and if the average ping is below this number, it fulfills the prime quality.
Since the tracker is designed to hold ping data from every hour of each day for over three months, it needs a method of calculation less subjective to outliers and indifferent to generally large changes to server stability. To help explain this, I’ll present an example.
Say all 30 channels for the game have a consistent ping average of 50 with low variance during regular times of the year. And say, during the Holidays, far more players are online. Now, all 30 channels have consistently higher ping average at 200 but also with low variance. This is not an outlier to the dataset, since this is a repeatable occurrence (multiple busy seasons in the year)! So, how do we prevent this from messing with our average ping and variance calculations?
Recursive Calculations
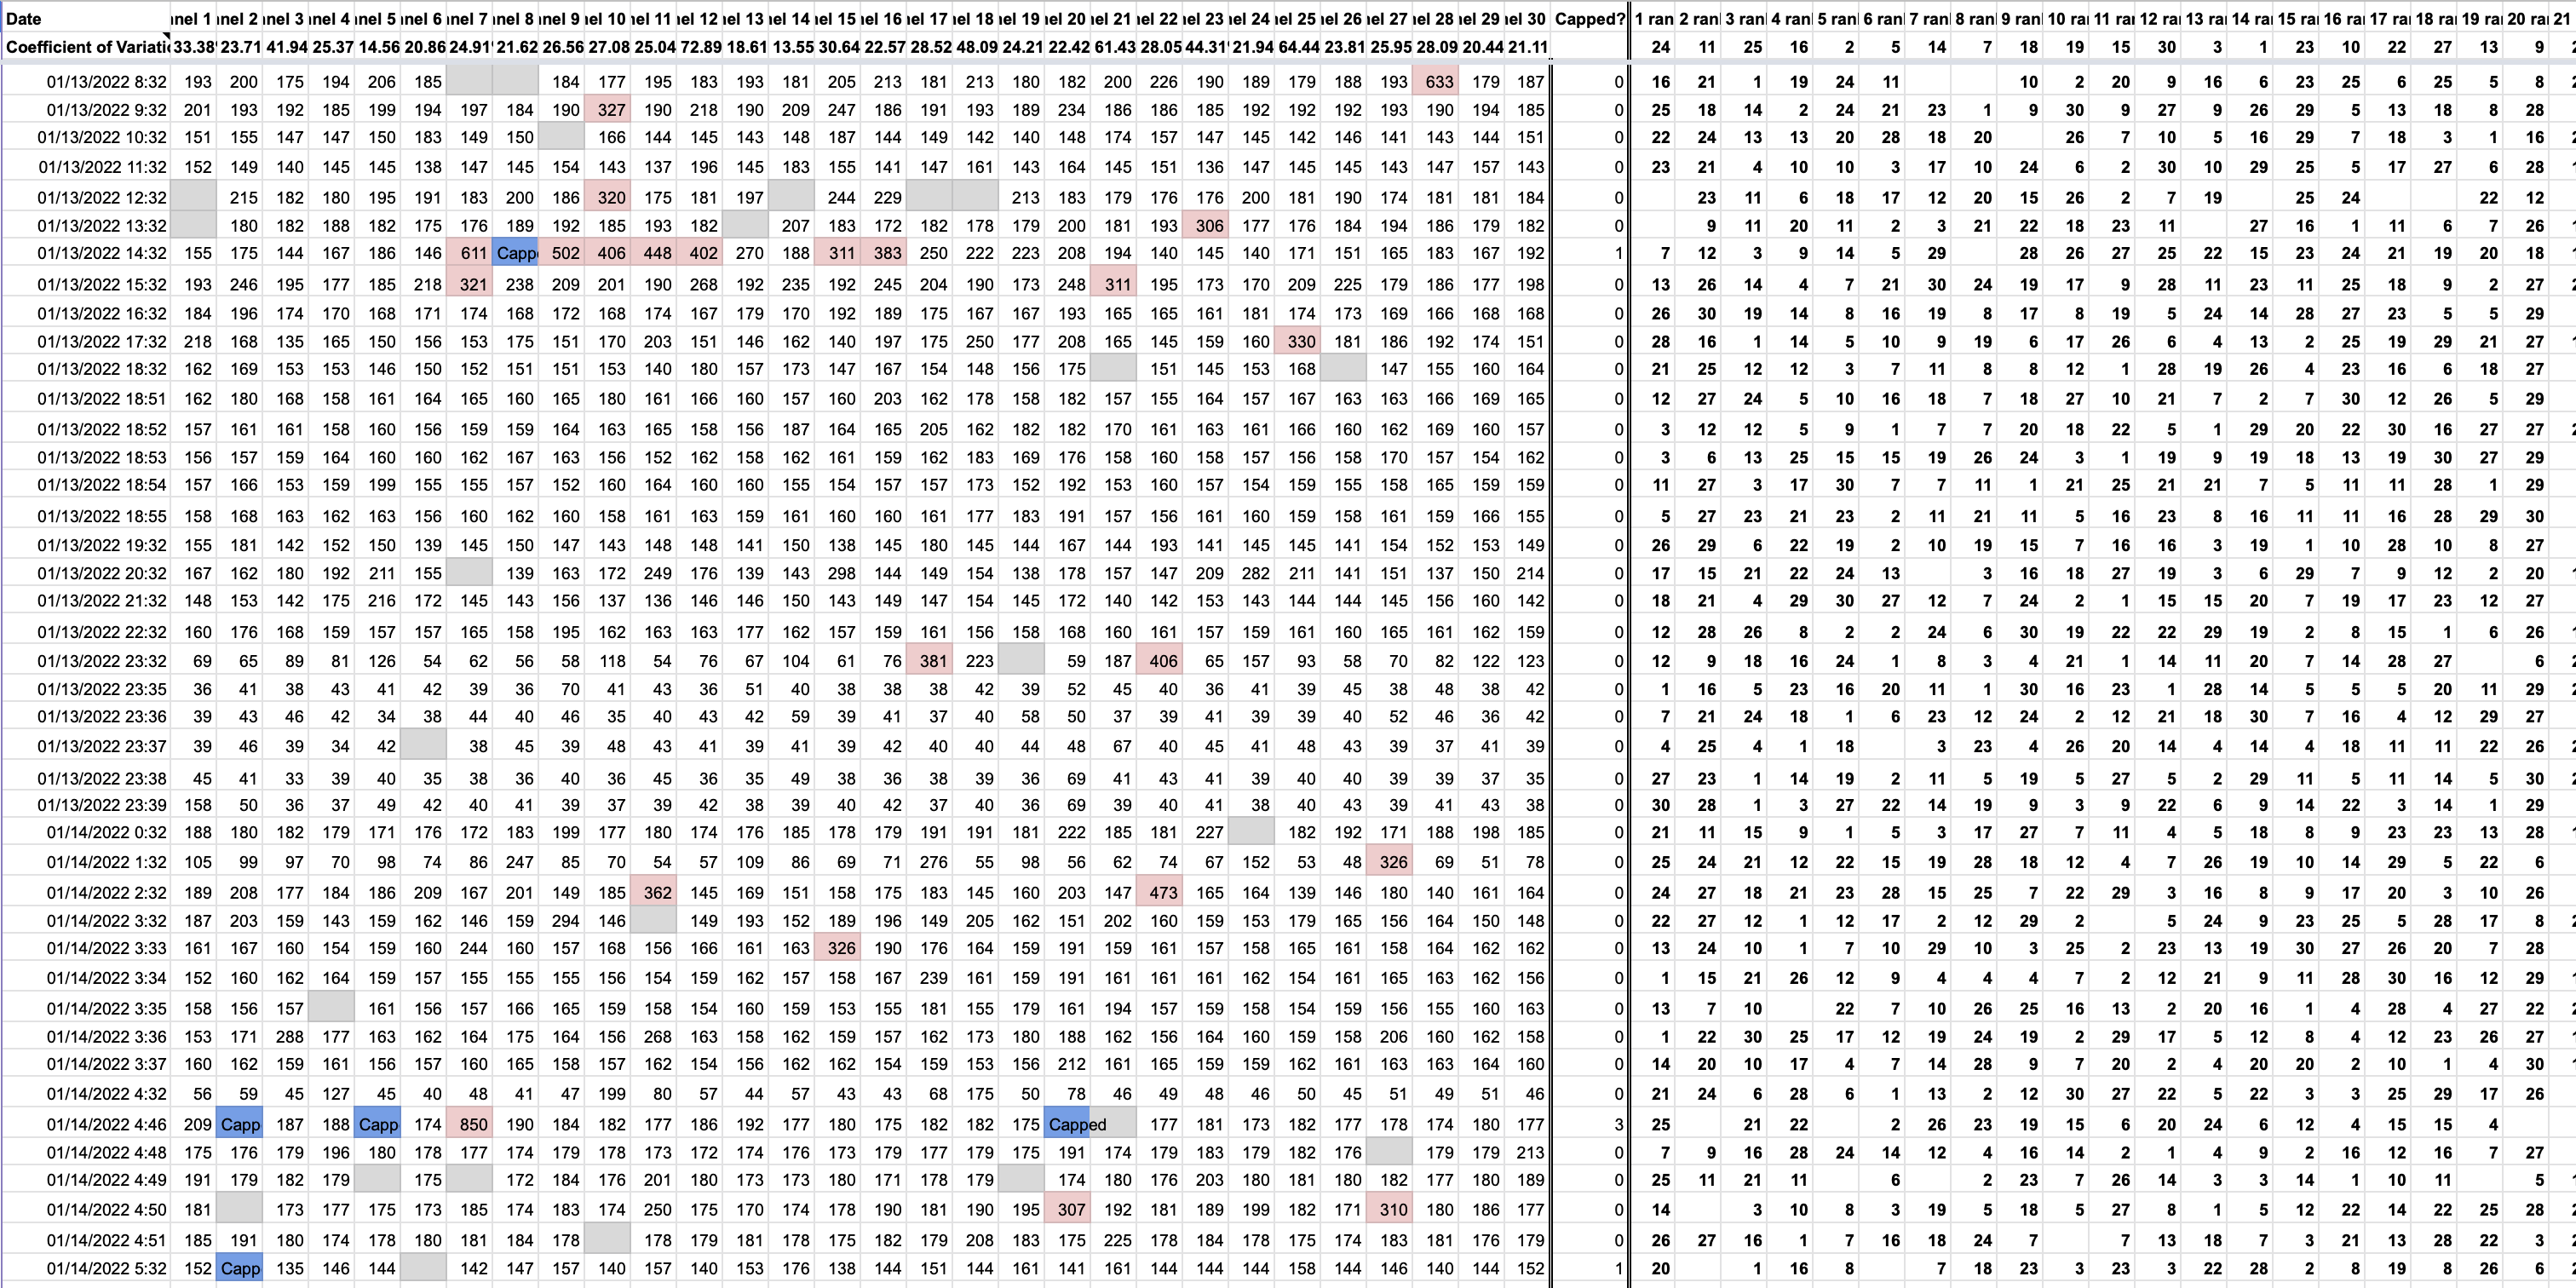
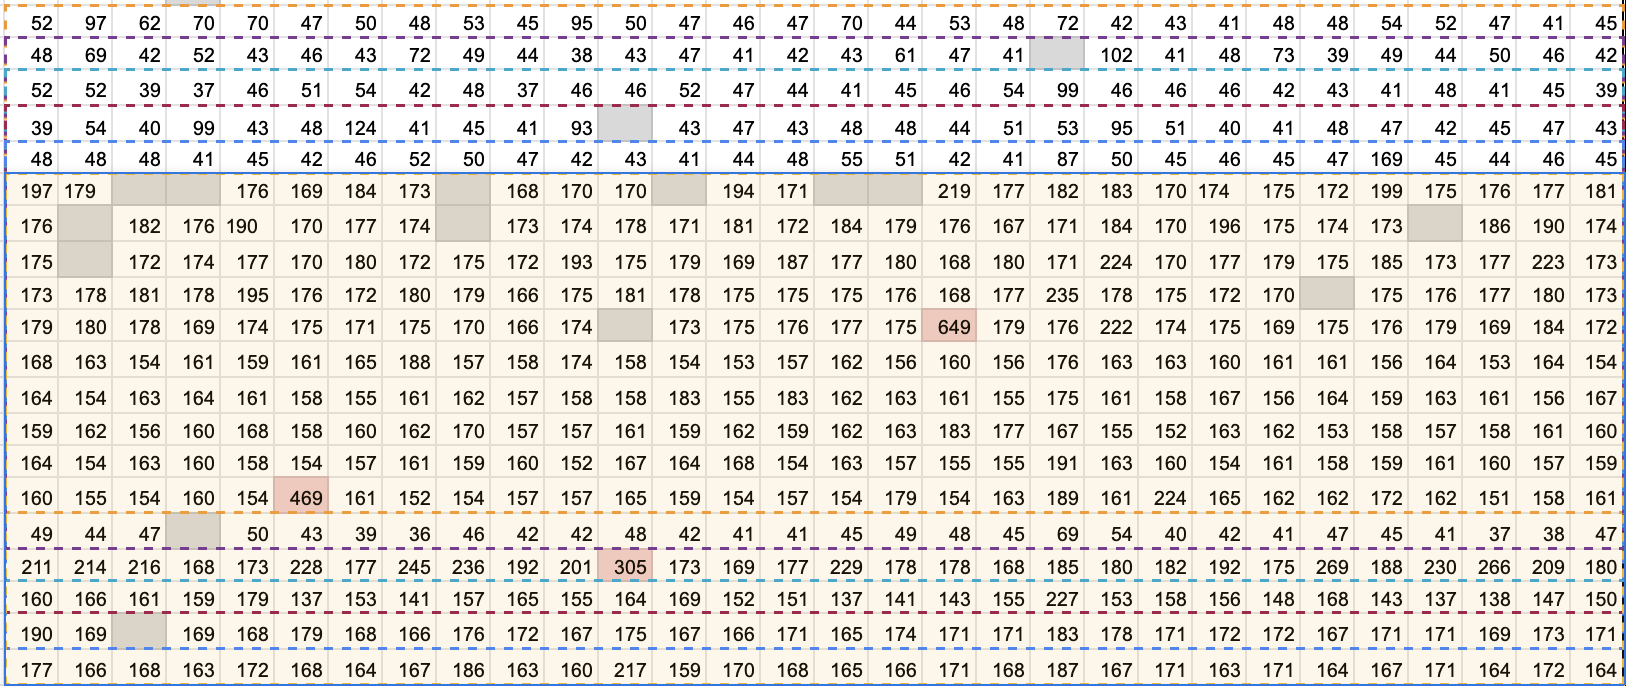
The solution is Recursive Calculations: instead of taking the average and variance of the entire dataset, I perform the average and variance calculations multiple times in increments across the data set. For the sheet, I set this increment at 15 separate ping updates.
Say that we have n separate ping updates for all 30 channels. The amount of total calculations present in the sheet is n-15, which can become a large sample size of calculated analysis. Below is an example presented of the “zones” of 15 rows each.
Creating the structure of the channel sheet was the easiest part. The channel tracker displays the channels in a format similar to how they are displayed in-game: 5 channels per row. This display presents an analysis of the 15 most recent server pings. Then, I created a table with each channel having its own row for displaying long-term results. Each channel is colored with conditional formatting to intuitively display which channels perform better or worse.
As mentioned before, the three ways for progressing in MapleStory are farming, legion training, and Tower of Oz. Now that players know which channels to play on, they need to plan and organize the gains that they want to make. The rest of the MapleTracker is dedicated to assisting players with this.
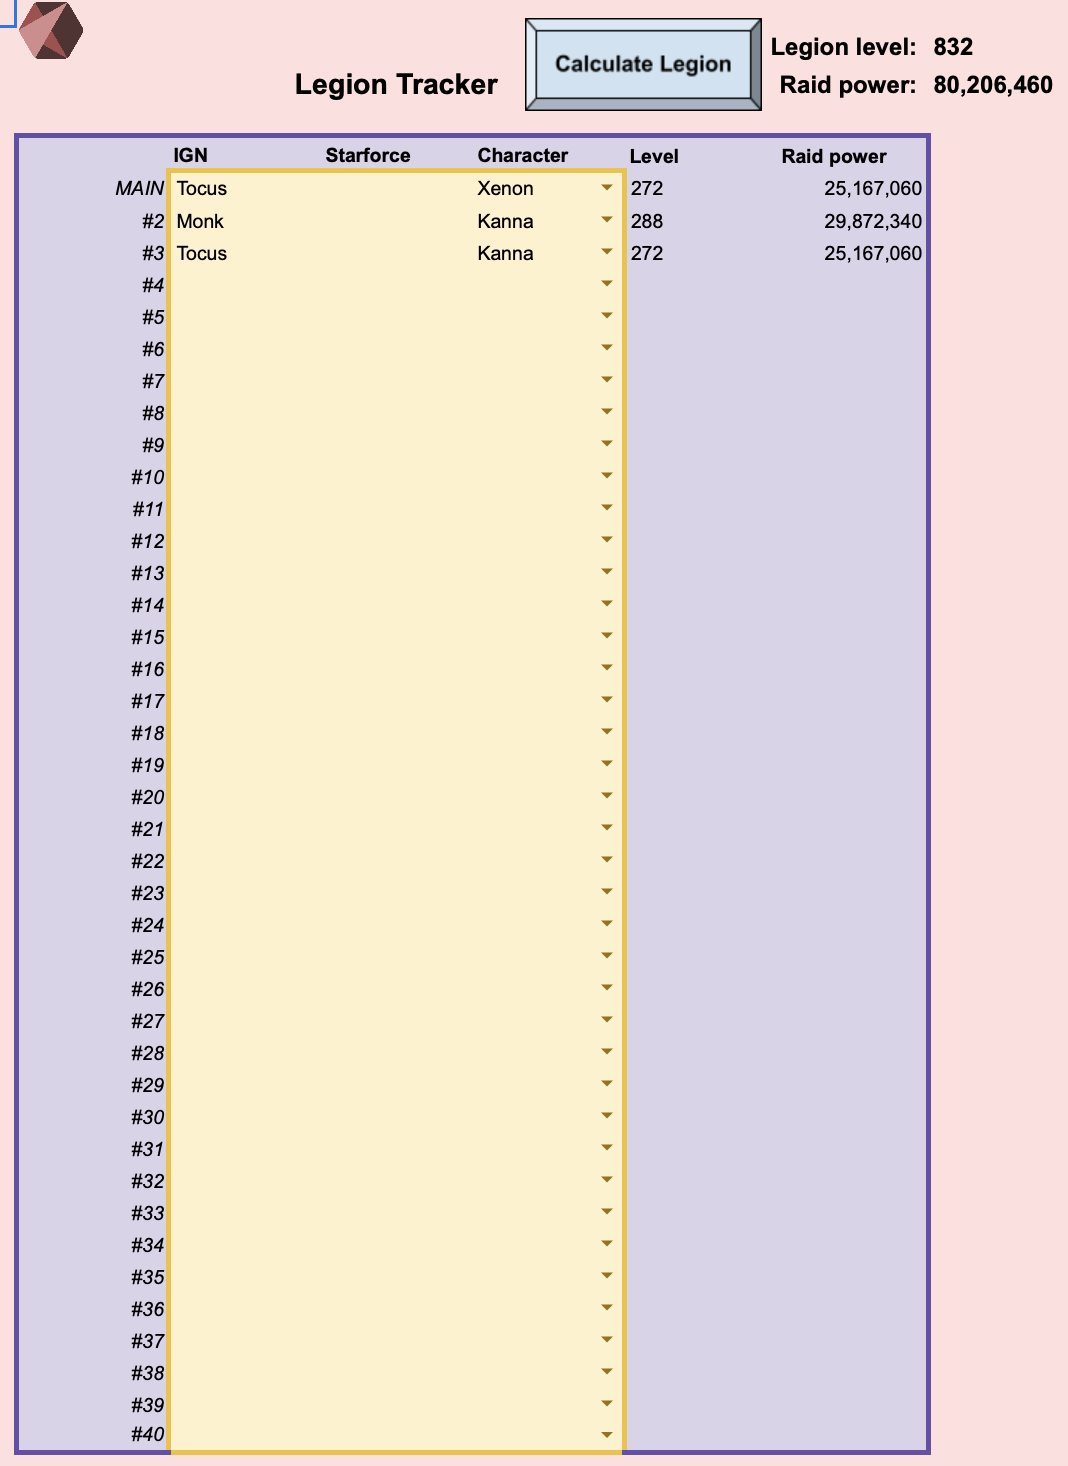
In MapleStory, a large and necessary part of endgame player progression is called Legion. In other words, it is the training of every single character class option to a specific level to reap their passive effects. Legion training is a simple process that can be done in a month of active play, so there isn’t as large of a need for it in the MapleTracker.
The Legion Tracker includes a realtime import of character level, a feature which no other MapleStory Legion tool has. Previously, all character levels had to be added manually. However, a player can now simply put their side characters’ names in each row to have its level imported. Unfortunately, there is no API for tracking starforce, so this needs to be manually inputted by the user.
Farming and training is the most demanding and time-consuming form of progressing in the game. It requires hundreds of hours of play and luck with spending to achieve endgame. Thus, a major part of this sheet was dedicated to assisting players with their farming in three different ways: How much currency they are going to get while farming, how much experience they are going to get while farming, and how they plan to spend the currency that they made.
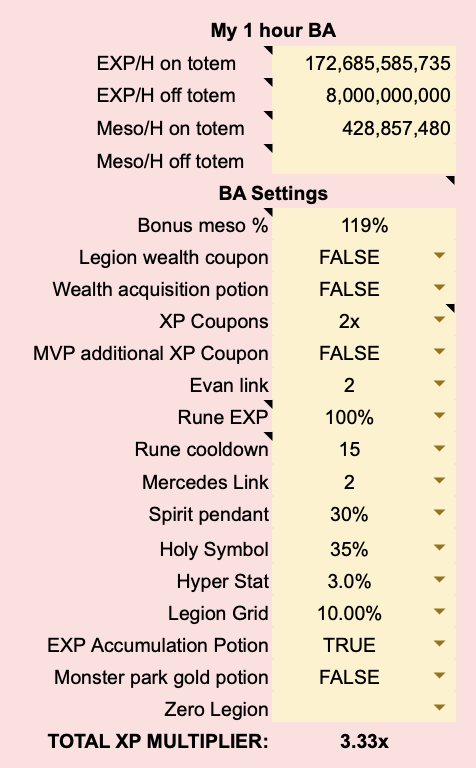
When farming in MapleStory, you gain experience and currency from killing mobs. They have a specific quantity of experience and meso that they drop. Thus, to create a trend of meso and experience per hour, a baseline needs to be created. This baseline is present in the Character Stats sheet, titled My 1 hour BA. In MapleStory, you can do something called a Battle Analysis which collects data on experience and meso acquired for up to one hour. Using this data, we can create trends.
One prominent part of training in MapleStory is experience and meso multipliers. They increase your rates significantly and are quite easy to obtain. Thus, to get the true baseline rate, the rate given from the 1 hour BA had to be divided by the various multipliers. This is why I added options below to show all multiplicative sources.
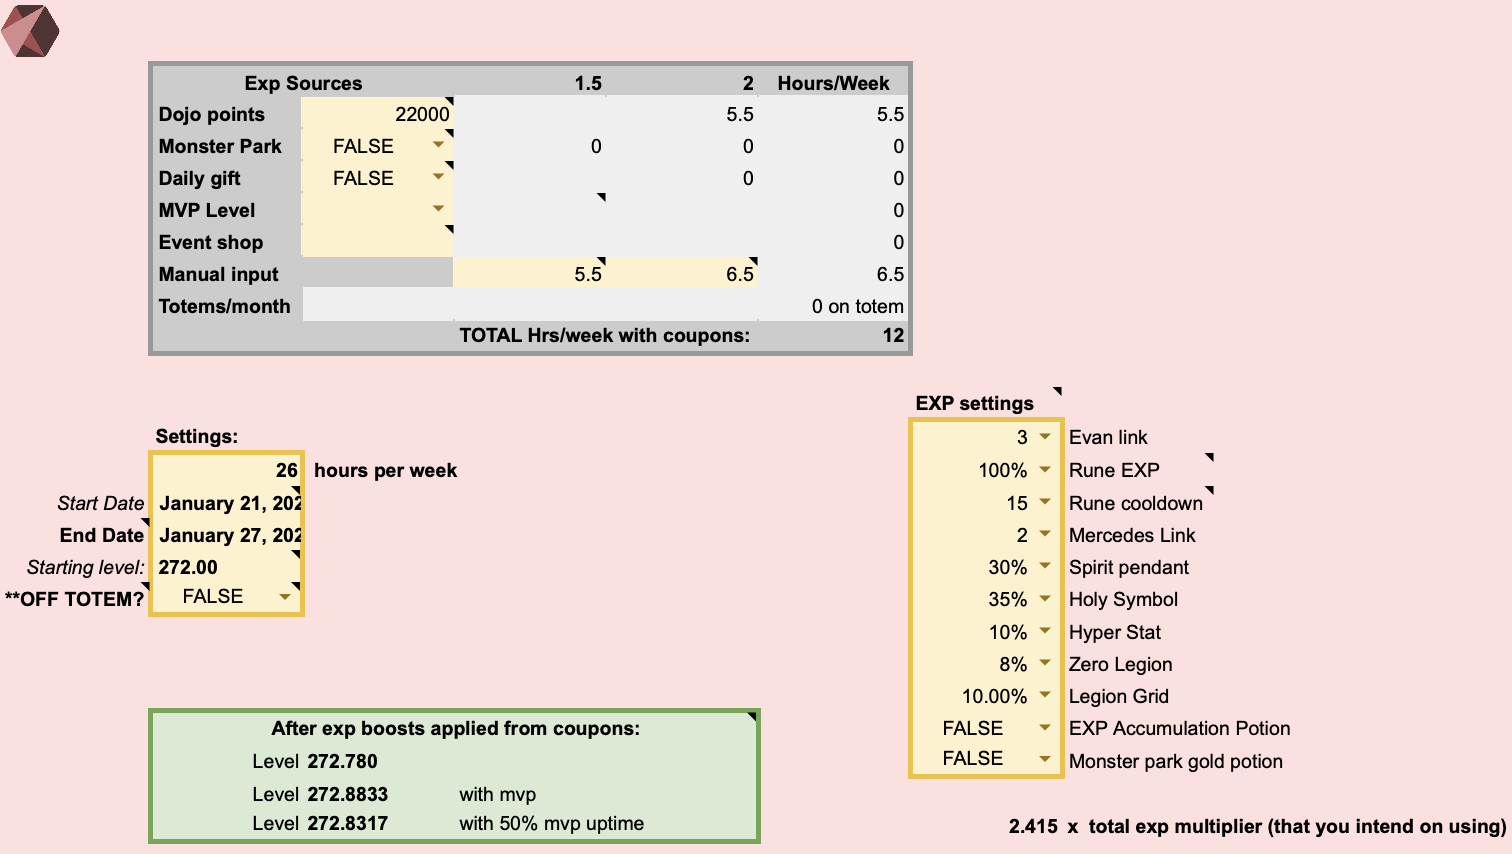
A largely rewarding part of training in MapleStory is gaining experience for levels. At higher levels, you have access to more bosses and higher base damage. So, I added a helpful tool to help users see various possible experience trends. Here are the sheet’s features:
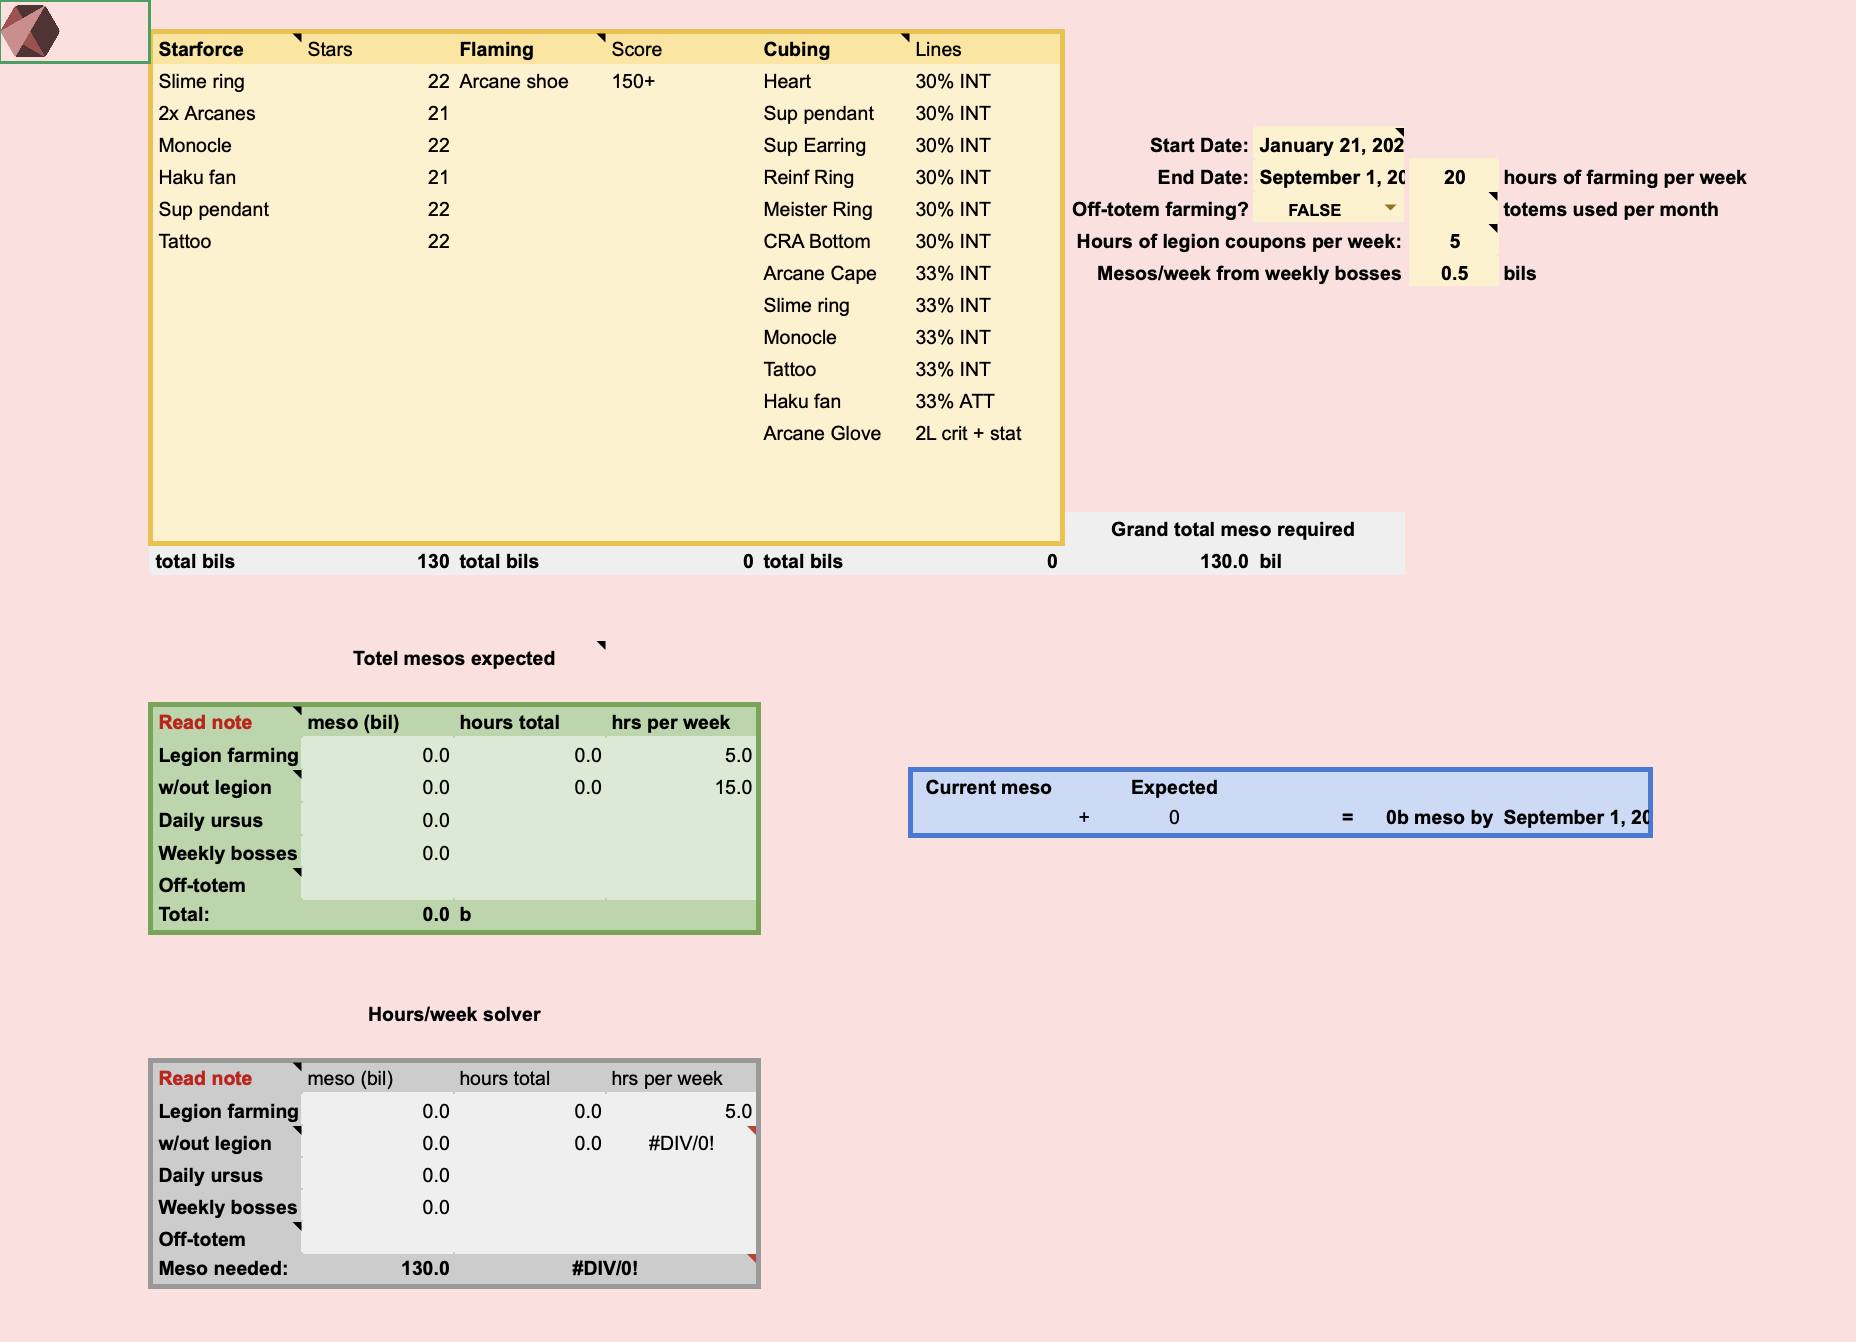
Similar to the Experience sheet discussed earlier, mesos are the second major half of the reward for farming. This sheet has the dual function of showing a user their trends for farming, as well as planning how to spend it on character progression. Here are the sheet’s features:
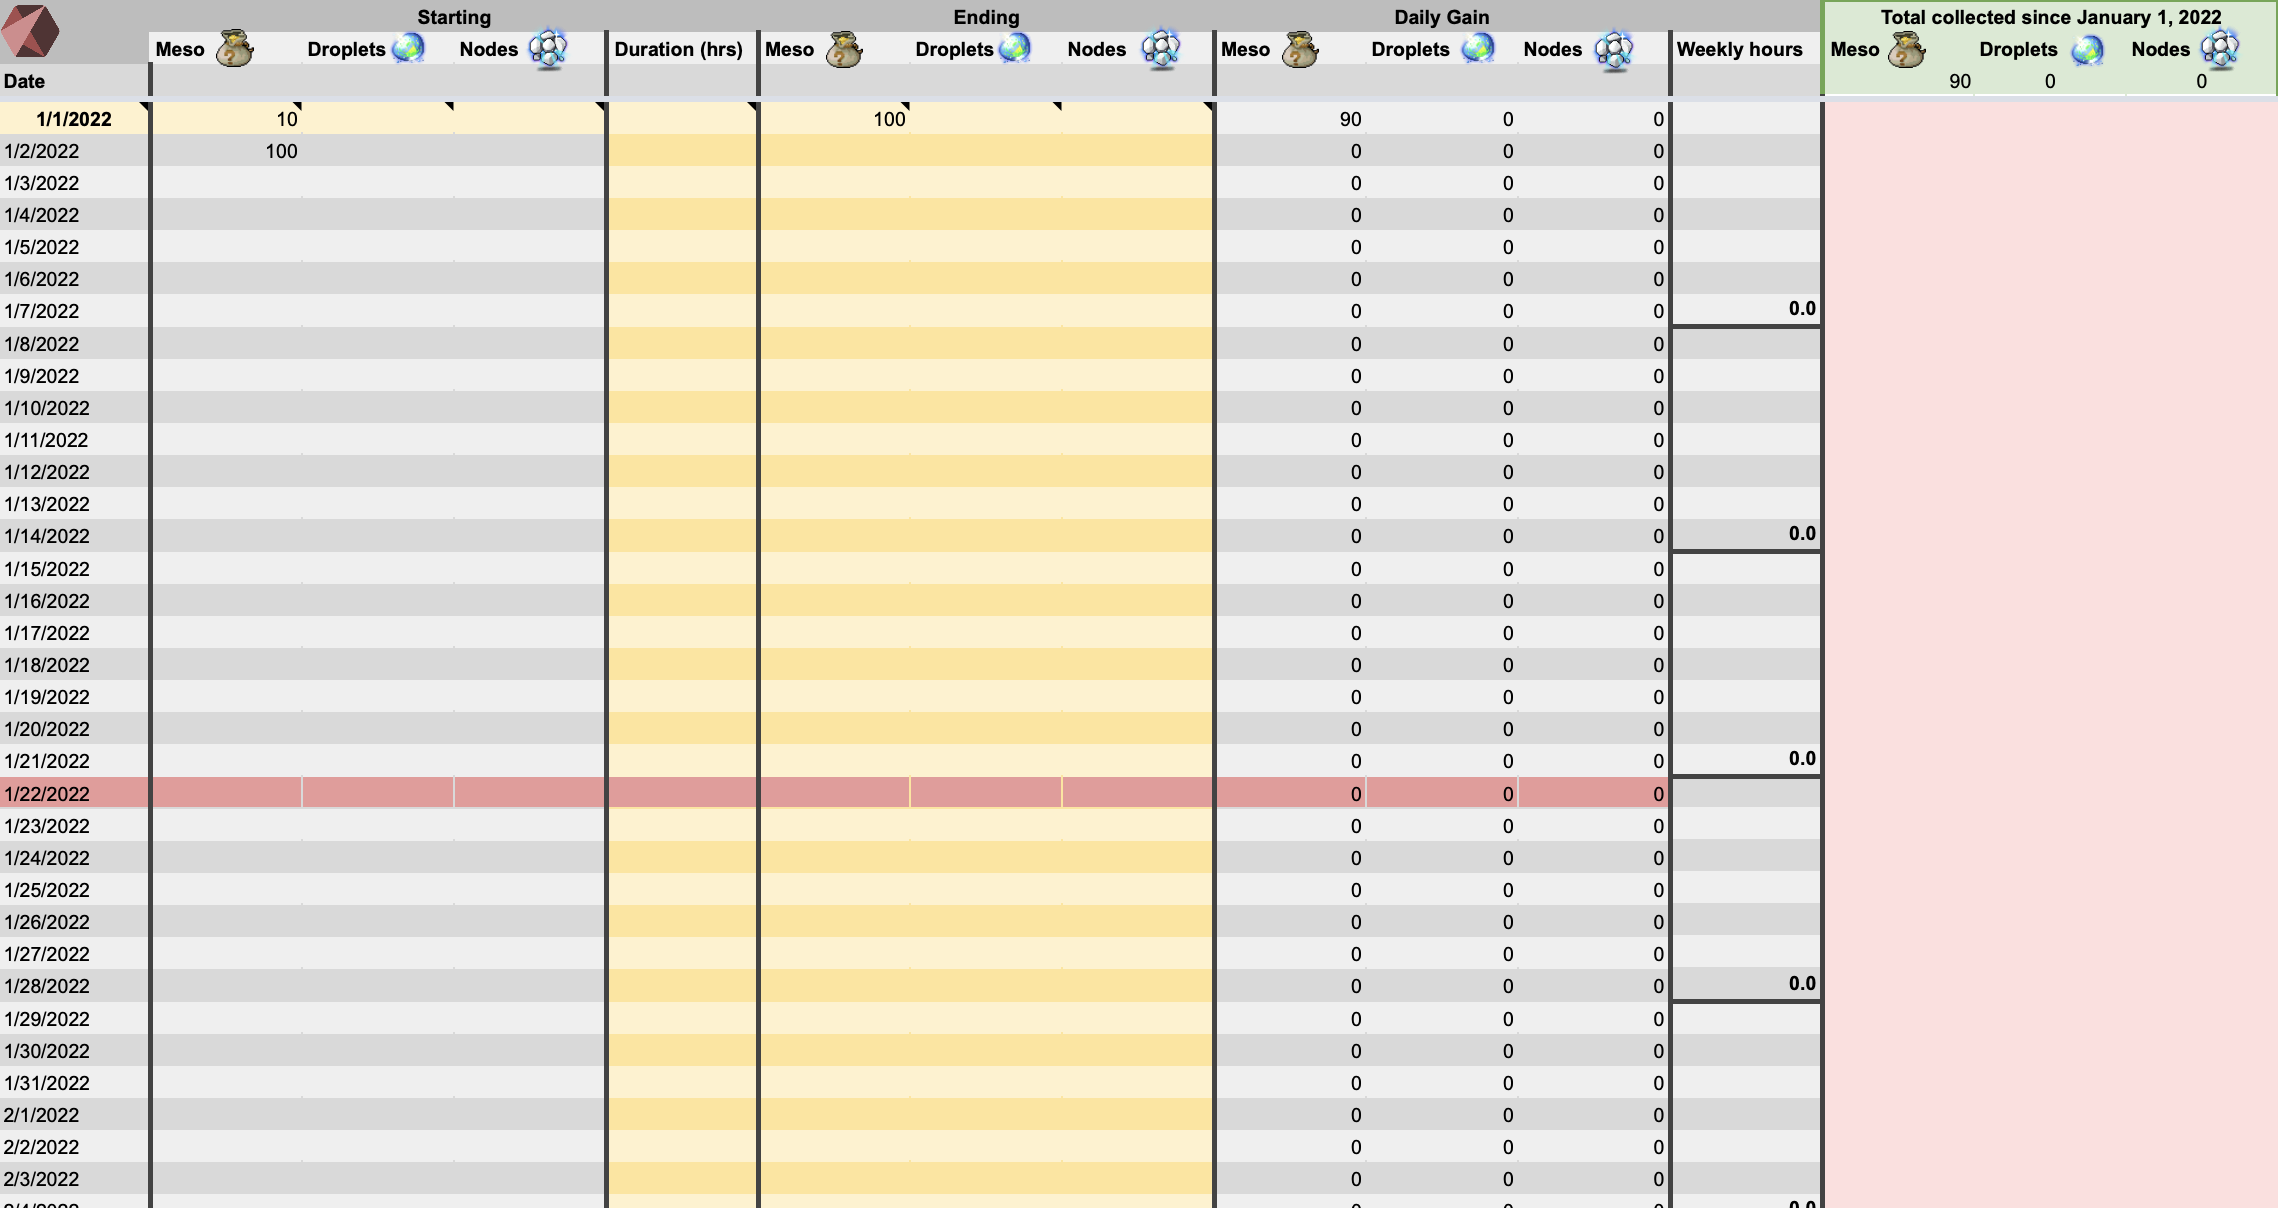
I added a feature for users who like to avidly track their farming gains day-by-day with a large farming tracker. To use the tracker, a user inputs how much meso, droplets, and nodestones they have before the start of their farming session. Then, the user inputs how much meso, droplets, and nodestones they have at the end of their session, and the sheet automatically calculates how much they made. The sheet ends up displaying the total statistics for how much they made since they started farming. In the future, I will also be adding trends since this would have access to a larger sample size.
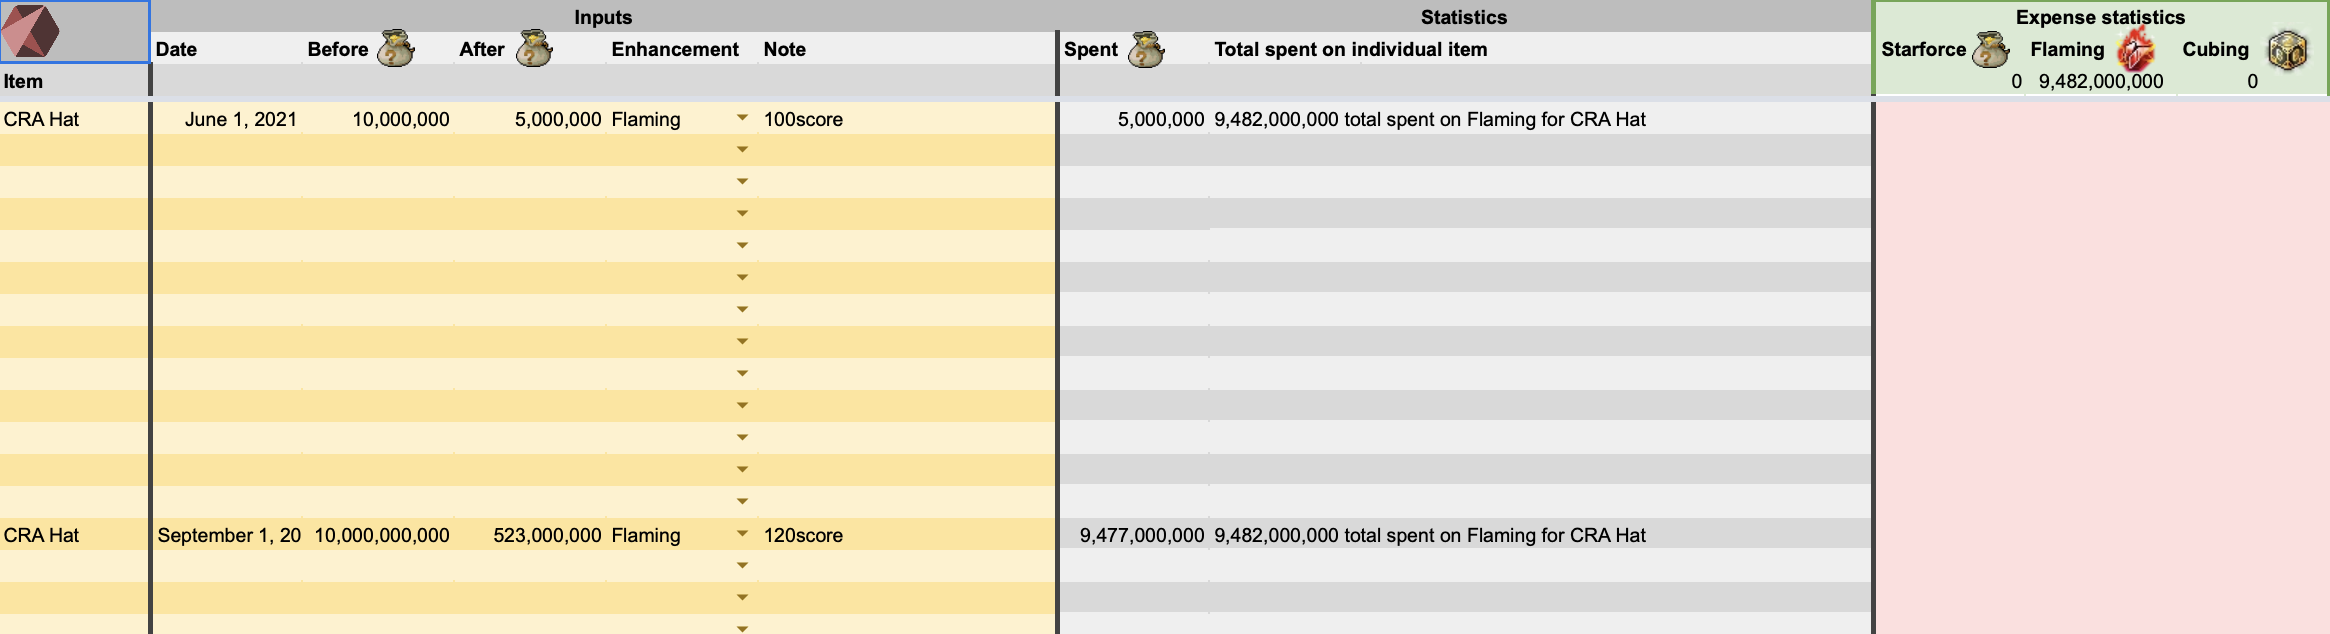
This sheet is dedicated to tracking how much a user spends. Since there are multiple ways of working on equipment, it quickly becomes a complicated thing to track. Players oftentimes track this with sheets. So, I made the sheet extremely intuitive to use. To add in an expense for something, a player simply denotes the equipment name, how much meso they had before spending, how much they had after, and the enhancement type. The rest is automatically calculated for the user.
Less specific to farming or for channel stability tracking, I added other tracking features to the sheet. I’ll go through each below.
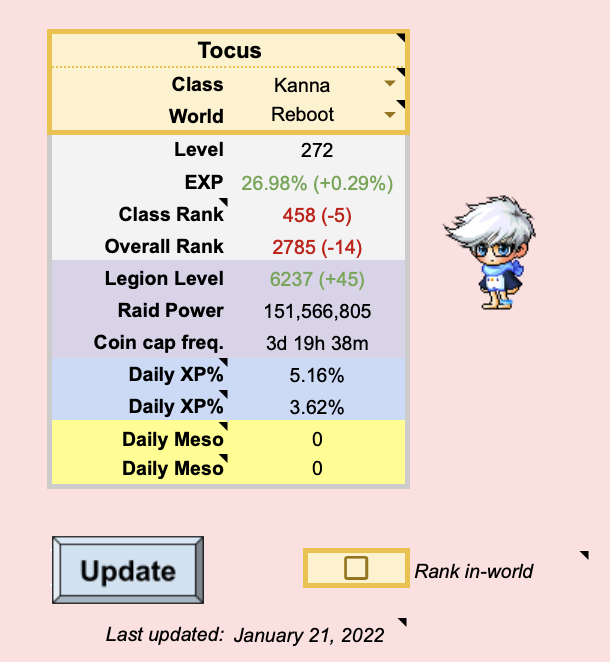
This sheet presents a dedicated display for a character’s stats. It displays their realtime experience trends, meso trends, legion trends, and other important character information. It even displays a realtime picture of their character! All of these trends (with the exception of experience and meso) can be derived from MapleStory’s rank API.
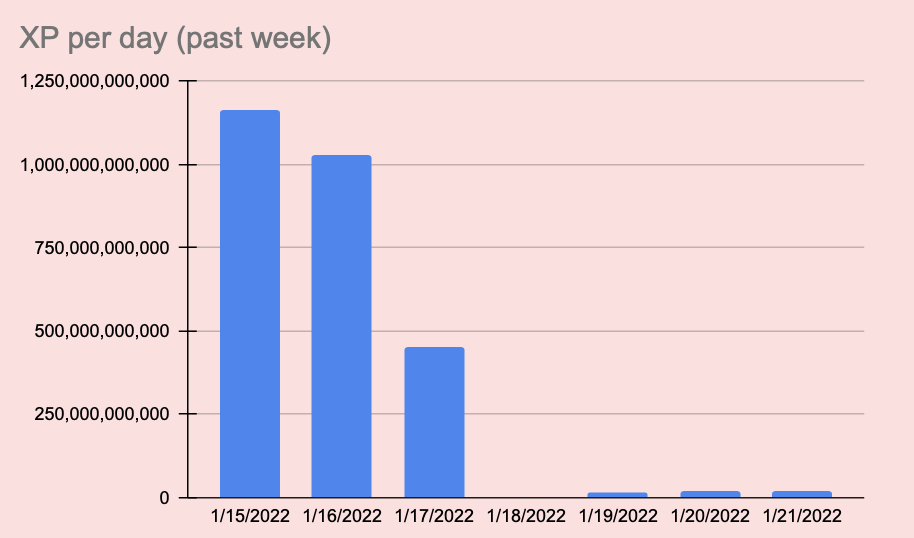
To track long-term trends of a character’s stats, I had to save this information somewhere. For this, I created the EXPTracking sheet, which saves character information every day. The collection and logging process is automated, so the user only has to start the update one time.
Bossing is a major part of the game, and it is the reason for progression to endgame. It is an extremely rewarding experience and gives the best rewards in the game. Bossing is done in parties of up to 6 people because they can be incredibly difficult to kill. So, I added a simple display for players to input their party makeup and damage. This can come in handy since there are about 10 different bosses that can not be cleared solo.
This feature was added in to assist users in a hassle-free sheet update. Unfortunately, Google Sheets has no way of importing function and formatting information, so the only realistic way to update a sheet is by creating a new copy of the original sheet.
All major customizable inputs in all sheets are denoted with a yellow cell with dark yellow borders. It would be incredibly convenient to have a system which imported sheet info into another sheet, in case of future major updates; So, I designed an optimized import and export feature! The procedure is split up into two parts.

To export settings, all a player has to do is copy one cell. That’s it!
I use the strjoin() excel function for the import and export of sheet settings. It allows me to add in a delimiter between string inputs, creating one large block of text of up to 50,000 characters, packed with sheet setting information.
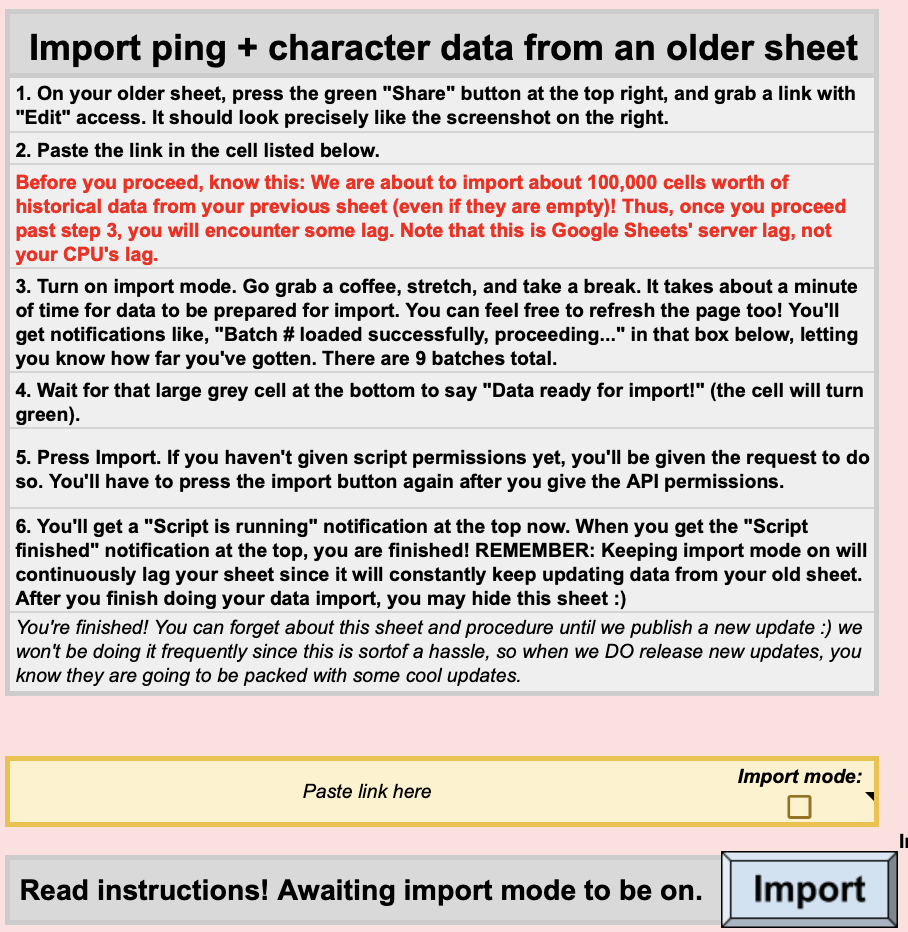
To export ping and character data, a user gets a shareable link to their original sheet (with editing access). This allows the IMPORTRANGE() function in Google Sheets to run.
Since character and ping information can consist of up to 60,000 cells worth of information, a regular strjoin() function would not have worked since it far exceeds a 50,000 character limit.
To import settings, all a player has to do is paste in one cell. That’s it!
To execute the import, I use the SPLIT() function on this one cell with the specific delimiters I used. Once I fully split up the cell information, I can paste these settings into the sheet.
To import ping and character data, all a user has to do is turn on import mode, wait until the notification turns green & says “Import ready!” and press the import button!
Importing ping & character data was created to be an easy procedure, but it was most complex problem from an engineering standpoint. How do you import 60,000 cells of a different sheet, hassle-free, without breaking it? The solution comes in two parts: the frontend and backend imports.
The frontend import consists of using exclusively excel functions to import data from another sheet. This uses the IMPORTRANGE() function. For 60,000 cells, this can be an incredibly demanding function. It will run the import even if the target cell on the original sheet is empty! So, I had some optimization work to do.
I ended up splitting the import into sections, so it wasn’t importing everything all at once. Once an import was done on a section, I added in another piece of optimization: Before importing the next large group of cells, I first checked its first row to see if it contained any data. If it was a fully empty row, then I could conclude the data import! This was done for both the ping and experience table sheets. It significantly cut down the import time and made it a reasonable way of importing a massive amount of data from one sheet to another.
Additionally, the IMPORTRANGE() function imports data every few minutes from the target sheet to check for updates. So, keeping these functions running in the background all the time makes the sheet unusable. My solution to this was import mode, which turns on the IMPORTRANGE() function in the sheet and starts the import process. This was done with a simple if-statement.
The backend import was incredibly easy to do. It was designed to run a quick script:
Due to the sheet’s size, I decided to invite a few friends and notable members of the MapleStory community to assist me in beta testing the sheet. My beta testing program ran for approximately two weeks, and we squashed tons of bugs and added many new convenient features. Only from including other people & getting their opinion can a project really take off! The original sheet version was v1.1, exclusively released for the beta testers. Once I finished implementing many fixes and formatting changes, the sheet looked entirely different! So, I coined the new version v1.2.
Since the Sheet’s release in August, a few extra features have been requested by the MapleStory community. I put these updates into a large collective to-do list, and has been accumulating since. I put the updates on hold to release this website and apply to internships, but I will quickly resume the sheet upkeep when I release the website. Once I release this next update, I will officially change the sheet version to v1.3, which should cover all bases and hopefully be the last major update of 2022.
11 usable sheets – Instructions, Import & Export, Sheet Settings, Character Stats, Channel Tracker, Farming Tracker, Meso Planning, Expense Tracker, Exp Tracker, Legion Tracker, Boss Parties.
6 sheets for backend – IMPORTEDDATA, Version, XPCurve, Format2, EXPTracking, PingTracking
Discord community – Linked here!